
Merchant fleet and port traffic in 2026: what 1.59 million port calls show
MagicPort recorded 1,593,387 port calls from January to September 2026, across a trading fleet of 54,003 vessels. Agents, owners and charterers plan around ship arrivals every day, yet most published port rankings count containers, not calls. State of the Maritime Industry Q1-Q3 2026 is MagicPort's data report on the trading fleet: where it calls, how long it stays, how fast it sails and who manages it.
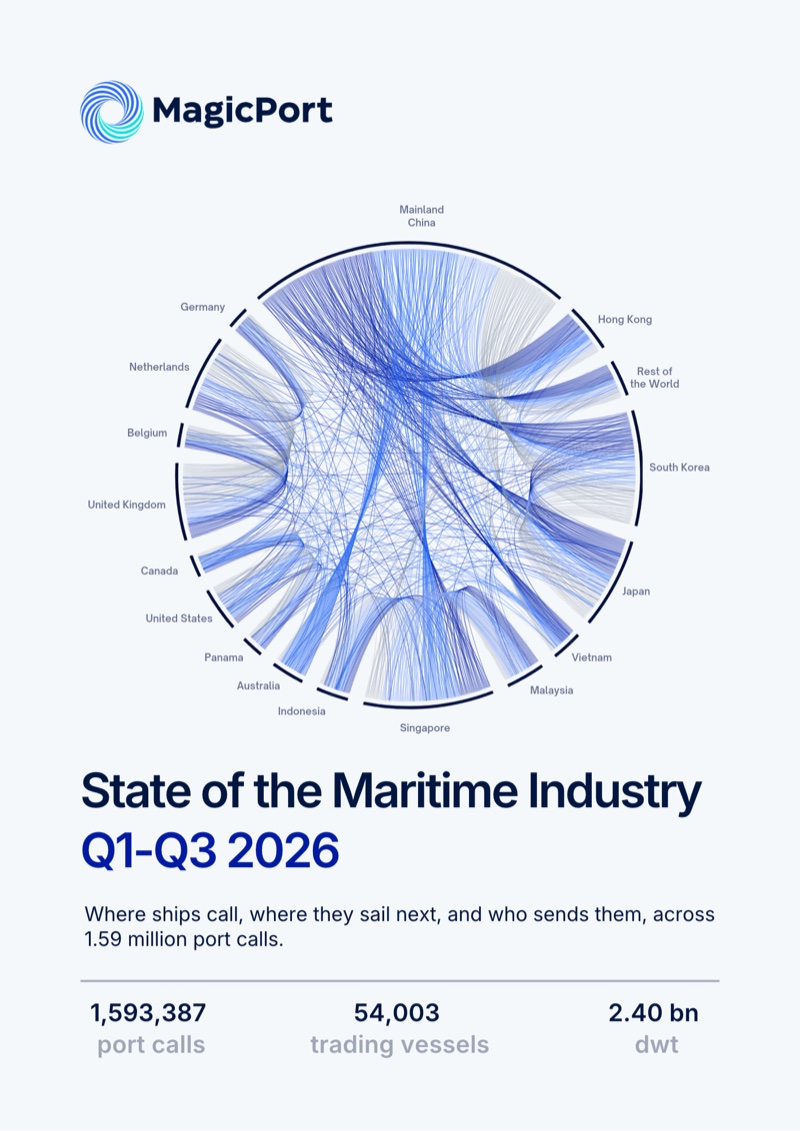
Port rankings built on containers miss most of the ships agents actually handle
Published port rankings measure throughput in twenty-foot equivalent units (TEU), which shows how many boxes a terminal moved. It does not show how many ships arrived, how long they stayed or which manager sent them. For a ship agent, a bunker supplier or a principal's operations team, the workload is the vessel, not the box.
A port call is one recorded vessel arrival at a port, so a ship calling at four ports in a month counts four times. That makes call counts a measure of activity, not cargo. Japan logged 207,214 calls at 6.4 calls per vessel a month: the same coastal hulls calling again and again. Singapore logged 52,765 calls at 1.4 calls per vessel a month: many different ships passing through a hub. The two look alike in a ranking and work nothing alike on the quay.
The same split runs through the fleet. Vessels aged 25 years and older are 27.1% of trading-fleet hulls but only 6.0% of its deadweight. The number you choose decides the story you tell, so the report shows both.
How the report measures
Every finding is read by count and by weight, because the two rank the fleet differently
Calls versus cargo
A port call shows that a ship arrived, not what it carried. Setting calls against the vessels behind them separates coastal systems from transit hubs.
Covers country/region rankings, busiest ports and cross-border corridors.
Hulls versus deadweight
General cargo ships are 27.3% of the trading fleet by hull count but carry just 4.3% of its deadweight. Bulk carriers carry 38.9% from 23.2% of hulls.
Covers fleet composition, age profile and flag registries.
Calls versus weighted calls
MSC Group handles 2.71% of port calls with a named commercial manager. Weighted by ship size, its share rises to 6.81%.
Covers commercial managers, owner groups and newbuild deliveries.
Busiest ports by port calls
Singapore handled 51,974 port calls, more than any other port in the world
The ten ports with the most trading-fleet calls from January to September 2026. Ports the source records under several codes, such as Ningbo-Zhoushan, are counted once.
| Rank | Port | Country/Region | Port calls | Share of world calls |
|---|---|---|---|---|
| 1 | Singapore | Singapore | 51,974 | 3.3% |
| 2 | Shanghai | Mainland China | 26,233 | 1.6% |
| 3 | Ningbo-Zhoushan | Mainland China | 24,865 | 1.6% |
| 4 | Rotterdam | Netherlands | 18,129 | 1.1% |
| 5 | Hong Kong | Hong Kong | 16,998 | 1.1% |
| 6 | Osaka | Japan | 12,784 | 0.8% |
| 7 | Nagoya | Japan | 11,782 | 0.7% |
| 8 | Mizushima | Japan | 11,712 | 0.7% |
| 9 | Antwerp | Belgium | 11,431 | 0.7% |
| 10 | Busan | South Korea | 11,033 | 0.7% |
Source: MagicPort port-call records, January to September 2026. Measured counts, trading fleet only: passenger ships, ferries and service craft are excluded. Monthly country/region editions are published in the Port Traffic Reports hub.
Time in port by vessel type
Median time in port runs from 11 hours for ro-ro to 52 hours for dry bulk
Time in port is total elapsed time from arrival to departure. It includes waiting, working and idle time, which port-call records cannot separate.
| Vessel type | Arrivals | Median stay (hours) | 90th percentile (hours) |
|---|---|---|---|
| Dry bulk | 280,534 | 52 | 257 |
| Tanker | 409,794 | 32 | 145 |
| General cargo | 348,203 | 31 | 161 |
| Reefer | 12,060 | 30 | 228 |
| Gas carrier | 74,031 | 29 | 132 |
| Container | 358,824 | 22 | 76 |
| Ro-ro / vehicle | 109,875 | 11 | 53 |
| All trading vessels | 1,593,387 | 28 | 148 |
Source: MagicPort port-call records, January to September 2026. Automatic Identification System (AIS) position data became far denser from June 2026, so these medians span two levels of timing precision. Chapter 1 of the report explains the change.
Vessels aged 25 years and older make up 27.1% of trading-fleet hulls but carry only 6.0% of its deadweight tonnage (dwt). Counted by hull, the fleet looks old. Weighed by carrying capacity, 82.6% of it is younger than twenty years.
Source: MagicPort fleet register, 8 October 2026
What the report covers
Eight data chapters, each stating what it measures and where it stops
Every figure is followed by the table behind it, with its period, denominator and coverage named under the source line.
Global port-call activity
The monthly series of 1,593,387 calls by trade, how denser position data from June 2026 changed the record, and why this edition publishes no growth rates.
Patterns by country/region
Port calls by destination country/region, calls per vessel, the vessel mix behind each destination's calls, and the 15 busiest cross-border corridors by segment.
World fleet: composition, size and age
54,003 trading vessels and 2.40 bn dwt broken down by vessel type, five-year age band and flag of registration, by hull and by tonnage.
Shipbuilding and newbuild deliveries
1,411 trading ships with 90.2 m dwt delivered in the window, by month and trade, with the leading yards in container, dry bulk and tanker.
Fleet turnover: ownership and flags
3,749 moves between flag registers and 4,306 registered-owner changes: where reflagged vessels go and which owner groups added tonnage.
Port performance: time in port
Stay distributions by segment, the 20 busiest ports by calls with segment splits, and container turnaround at the 15 busiest terminals.
Vessel speed and operational tempo
Underway speed from 40,616 trading ships on sampled days, and port-to-port passage speed month by month for container ships, bulk carriers and tankers.
Commercial managers: who runs the owners' fleets
The 12 largest commercial-manager groups by share of calls and by tonnage-weighted share, and the two operating models hidden in one ranking.
Built for agents, owners, managers and charterers who plan around port calls
This report is written for ship agents, ship owners and managers, charterers, brokers and the commercial teams that serve them. It assumes you know what deadweight, a commercial manager and an open registry are. It does not forecast freight rates, estimate cargo volumes or rank liner capacity, and it says so wherever the data stops. If you need a market outlook, this is not it.
Frequently asked questions about merchant fleet and port call data
Frequently asked questions about merchant fleet and port call data
What is the busiest port in the world by port calls?
Singapore was the busiest port in the world by port calls from January to September 2026, with 51,974 calls by trading vessels, 3.3% of all calls recorded worldwide. Shanghai followed with 26,233 calls and Ningbo-Zhoushan with 24,865. Singapore ranked first for tanker and dry bulk calls and second for container calls behind Shanghai, partly because many vessels call there to bunker, change crew or wait for orders. Rankings measured in twenty-foot equivalent units (TEU) count containers handled rather than ship arrivals, so they can order ports differently.
How long do ships stay in port?
The median trading vessel stayed 28 hours in port from January to September 2026, measured from arrival to departure across 1,593,387 arrivals. The median varies by segment: 11 hours for ro-ro and vehicle carriers, 22 hours for container ships, 32 hours for tankers and 52 hours for dry bulk carriers. Time in port is total elapsed time and includes waiting, working and idle time, which port-call records cannot separate. One in ten dry bulk stays ran past 257 hours.
How long does a container ship stay in port?
Container ships spent a median of 22 hours in port from January to September 2026, based on 358,824 container ship arrivals. Turnaround differs by port: among the 15 busiest container terminals, Xiamen had the shortest median stay at 13 hours and Jakarta the longest at 41 hours, a 3.2x difference. Shanghai recorded 16 hours, Singapore 24 hours and Rotterdam 36 hours. A long median can reflect congestion, larger cargo exchanges per call, or both.
How many merchant ships are there in the world?
MagicPort's fleet register held 54,003 trading vessels with a combined 2.40 billion deadweight tonnes (dwt) on 8 October 2026. The trading fleet counts seagoing ships that carry cargo between ports: bulk carriers, tankers, gas carriers, container ships, general cargo, reefer, ro-ro and vehicle carriers. It excludes passenger ships, ferries, fishing vessels, tugs, offshore units and government ships, so totals that include those categories are higher. General cargo ships are the most numerous type, at 14,760 vessels.
What is the average age of the world merchant fleet?
The trading fleet in MagicPort's register had an average age of 19.7 years in October 2026, but the answer depends on how the fleet is counted. Vessels aged 25 years and older make up 27.1% of hulls yet carry only 6.0% of deadweight tonnage (dwt), because the oldest ships are mostly small. Weighed by carrying capacity, 82.6% of the fleet is younger than twenty years, and the heaviest age band is 15 to 19 years, with 24.7% of deadweight.
Is Panama still the largest ship registry?
Panama is not the largest ship registry by deadweight: Liberia leads with 481.9 million deadweight tonnes (dwt) on 5,697 vessels, 20.1% of the trading fleet. The Marshall Islands ranks second with 334.1 million dwt and Panama third with 272.9 million dwt, although Panama still has the most vessels, at 5,721. Between March and September 2026, the Panama register lost a net 970 vessels to other flags, most of them to the Marshall Islands.
What is the difference between a commercial manager and a technical manager?
A commercial manager is the party commercially responsible for a vessel's employment and acts for the owner on chartering and trading decisions, while a technical manager, often the International Safety Management (ISM) manager, is responsible for the ship's operation, maintenance, crewing and safety management. The commercial manager named on a port call is not necessarily the registered owner, the corporate parent or the charterer operating the ship. In MagicPort records, 99.5% of port calls from January to September 2026 named a commercial manager.
Where does the data in this report come from?
Every figure in State of the Maritime Industry Q1-Q3 2026 comes from MagicPort's own maritime data: port-call records inferred from Automatic Identification System (AIS) position reports, the fleet register, newbuild deliveries and vessel lifecycle events. No external series, estimate or forecast enters a figure. Because the AIS position data behind the record became far denser from June 2026, call counts before and after that month are not directly comparable, so this Q1-Q3 2026 edition publishes no growth rates.
About MagicPort
The vessels and managers in this report are searchable one by one in Maritime Intelligence
This report aggregates more than 1.5 million port calls. Maritime Intelligence puts the same data to work on a single counterparty: track a vessel, read its voyage history and check the companies behind it before you accept a nomination or quote a job.
Updated AIS tracking
Follow a vessel's position and recent port calls on the same AIS-based records behind this report.
Voyage history by port
Read where a vessel has traded and how long it stayed, port by port, before you commit to a call.
First-pass watchlist screening
Run a fast first check of a vessel or company against 300+ government and international watchlists.
400+ shipping companies across 80+ countries use MagicPort to improve their operations and customer service, and grow their business efficiently.
Download the State of the Maritime Industry report
We will email the 47-page PDF of State of the Maritime Industry Q1-Q3 2026, covering January to September, directly to your inbox.